 Skip to content


A Prop Betting Strategy That Actually Beats the Market
The best prop betting strategy is an EV-first workflow: prioritize minutes and usage over box-score narratives, shop lines across multiple books before you bet, and size every wager with fractional Kelly discipline. That’s it. Everything else in this guide is detail on how to execute those three moves correctly, every single time you look at a player prop.
Before you place anything today, run this quick check:
- Minutes and usage: has the player’s role changed in the last 5 games, and is anyone ahead of them injured or resting?
- Implied probability: convert the odds on your prop to a no-vig true probability, not just the book’s number.
- Line shop: compare the same prop across at least three sportsbooks before locking in.
Prop markets carry more variance than sides and totals, so a single loss means nothing and a single win proves less. What matters is whether your process generates a positive edge across hundreds of bets, tracked honestly over time.
Key Takeaways
A disciplined prop betting strategy wins by combining accurate probability estimates with strict no-vig line comparison and conservative fractional-Kelly staking, tracked over hundreds of bets.
| Point | Details |
|---|---|
| EV is the only real filter | Only bet when your no-vig-adjusted edge clears roughly +3%, confirmed with a sensitivity check. |
| Minutes and usage drive NBA props | A player’s minutes trend matters more than his season scoring average for counting-stat props. |
| Small samples lie | Fewer than 50 games carries a substantial standard error, wide enough to make hot streaks meaningless. |
| Size bets conservatively | Use a quarter or a third of full Kelly, capping most props at 1-3% of your bankroll. |
| Elite Bettings applies this process daily | Elite Bettings documents its picks publicly with transparent results, including a free first pick available. |
Table of Contents
- Building a Prop Betting Strategy Around Expected Value
- What Actually Moves a Player Prop Line?
- How Much Data Do You Actually Need to Trust Your Numbers?
- Why Line Shopping Might Be Your Highest-ROI Habit
- A Repeatable Checklist for Every Player Prop You Bet
- Getting Bet Sizing Right When Variance Runs High
- Which Tools Actually Speed Up Prop Research?
- 🏆 Elite Bettings: Documented Picks Built on This Exact Process
- How In-Play Prop Betting Changes the Math
- Keeping Your Head Straight Through the Variance
- NBA vs. NFL vs. MLB: Why One Prop Strategy Doesn’t Fit All
- Why Most Bettors Get Prop Strategy Backward
- Turn This Framework Into Picks You Can Actually Use
- Sources
- FAQ
Building a Prop Betting Strategy Around Expected Value
Expected value is the only number that matters once you strip away the hype around any player prop. It answers one question: if you made this exact bet a thousand times, would you come out ahead? The formula is simple:
EV = (P_win × Profit) − (P_lose × Loss)
Start with the odds conversion. American odds of -110 mean you risk $110 to win $100, which converts to implied probability using P = odds / (odds + 100) for negative odds. At -110, the break-even win rate sits at roughly 52.4%, which is the number every sportsbook is quietly betting you can’t beat.
Here’s the process, step by step:
- Convert the listed odds to implied probability. For -110, that’s about 52.4%. For +150, it’s 40%.
- Remove the vig. Sportsbooks bake in a margin on both sides of a prop, so the over and under won’t sum to 100%. Add both implied probabilities together, then divide each side by that total to get the true no-vig probability.
- Estimate your own win probability using minutes, usage, matchup, and pace data (covered in the next section).
- Plug your estimate into the EV formula against the book’s payout structure.
- Run a sensitivity check. Recalculate EV at your estimate minus 5% and plus 5%. If the bet still shows positive EV at the low end, it’s a real edge, not a rounding error.
Set a personal floor: don’t bet unless your no-vig-adjusted edge clears +3%. That buffer absorbs the noise in your own estimate and keeps you from betting on rounding errors dressed up as value.
What Actually Moves a Player Prop Line?
Minutes and usage rate drive nearly every counting-stat prop in the NBA, more than matchup, more than recent hot streaks, more than anything else you’ll find on a stat sheet. Estimating minutes better than the market does is where most of the real edge in NBA props lives.
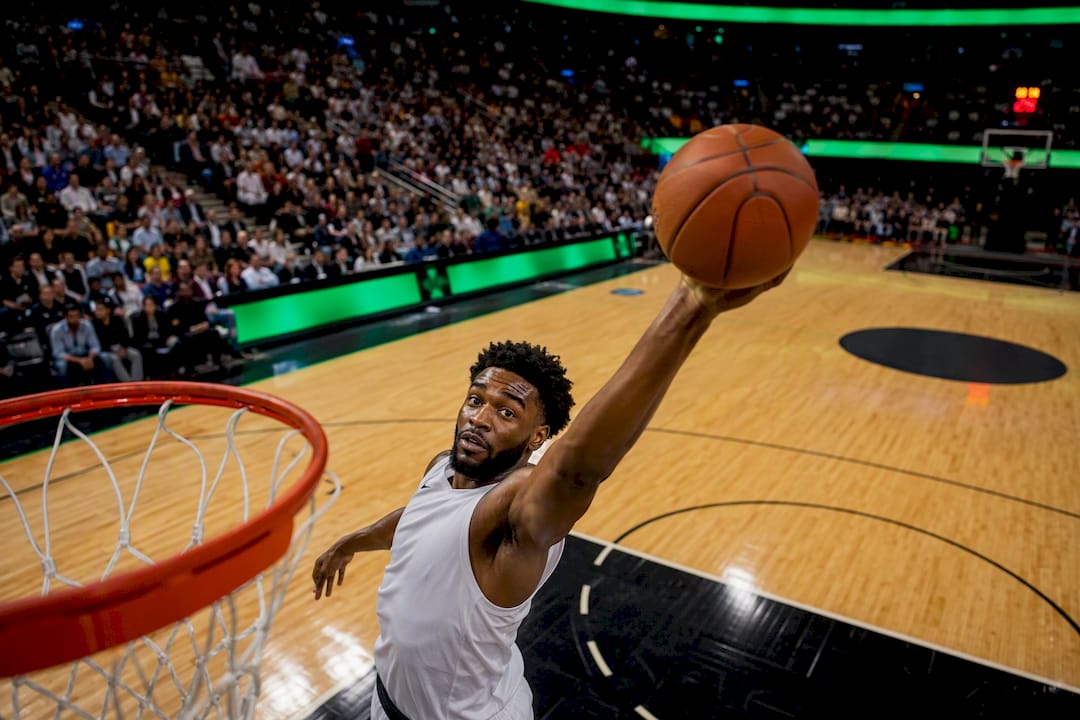
Usage rate measures the share of a team’s possessions a player uses while on the floor, through shots, free throws, and turnovers. When a starter sits out, that usage doesn’t vanish. It cascades to two or three other players, sometimes unevenly.
Pace and game total matter too. A game projected at 240 total points creates more possessions than one projected at 215, which lifts the ceiling on every counting stat in that game regardless of individual skill.
A few checks worth running before every bet:
- Check the team’s projected pace and total against their season average.
- Look up defense-versus-position (DvP) rankings on sites like Basketball-Reference to see how a team defends the specific position you’re betting.
- Confirm the latest injury report within 2 hours of tip-off, since NBA rosters shift fast.
- Cross-reference last 5 games against the full season to catch role changes early.
It’s your anchor against a hot or cold stretch that regresses hard.*
How Much Data Do You Actually Need to Trust Your Numbers?
Fifty games of data feels like a lot until you calculate the standard error on it.
That gap explains why a player’s “hot streak” over his last 8 games tells you almost nothing reliable. Small samples swing wildly, and betting on them as if they’re stable signals is one of the fastest ways to bleed a bankroll.
- Calculate standard error using SE = √(p(1−p)/n), where p is the hit rate and n is the sample size.
- Build a rough 95% confidence interval by adding and subtracting roughly 2 standard errors from your observed rate.
- Apply regression to the mean. A player shooting 45% from three over his last 10 games, against a career mark of 36%, is not actually a 45% shooter. Blend the two, weighted toward the larger, more stable sample.
- Favor the median over the mean for skewed stats like three-pointers made or steals, where a handful of outlier games inflate the average and make the “typical” performance look higher than it is.
Treat recent streaks as a data point, not a verdict.
Why Line Shopping Might Be Your Highest-ROI Habit
Prop markets are priced less carefully than sides and totals, and that gap is where most exploitable value sits. Books often set opening lines and alternate lines with less rigorous modeling than their point spreads, since fewer bettors and less sharp money hit those markets early. That creates windows, especially right after injury news breaks or when a line first posts, where the price hasn’t caught up to reality yet.
To find those windows consistently:
- Normalize every book’s odds into no-vig implied probability before comparing them, not raw odds.
- Watch injury reports closely. A downgrade posted 90 minutes before tip often moves slower on some books than others.
- Check opening lines within the first hour they’re posted, before sharp action corrects them.
- Look at alternate lines and player combo props, which get less pricing attention than the main number.
Public bettors lean toward overs by habit and hope, which nudges some unders into genuine value simply because the crowd won’t touch them. Tracking your closing line value over time, meaning whether your bet’s price improved or worsened by the time the game started, is the single best long-run signal that your process actually finds value rather than just getting lucky. Comparing odds across multiple sportsbooks before every bet compounds into real ROI over a season.
A Repeatable Checklist for Every Player Prop You Bet
Treat this as a routine, not a suggestion. Sharp bettors run some version of this on every single prop, and the discipline is what separates a process from a hunch.
- Pull the market info (1-2 minutes). Note the line, the odds, and which books are offering it.
- Gather the data (5-10 minutes). Look at the last 50 to 200 game logs, the minutes trend over the last 10 games, current usage rate, and the opposing defense’s DvP ranking.
- Adjust for context. Factor in injuries, rest days, back-to-backs, and the projected pace and total for the game.
- Estimate probability and run the EV calculation, including your plus-or-minus 5% sensitivity check.
- Decide your stake size and log the bet, including the closing line, so you can track CLV afterward.
Here’s how that looks on a hypothetical NBA points prop. A forward is listed at 21.5 points at -110. His last 5 games show a minutes bump from 29 to 33 due to a teammate’s ankle injury, and the opposing team ranks in the bottom five defending his position.
- Record the stake, the odds, and the projected edge before tip-off.
- Note the closing odds after the game locks so you can measure CLV.
- Review the outcome, win or lose, against your process, not just the result.
Checking daily NBA player props against this exact structure is how the process compounds into a season-long edge instead of a one-off guess.
Getting Bet Sizing Right When Variance Runs High
The Kelly Criterion tells you the mathematically optimal fraction of your bankroll to bet based on your edge and the odds, but full Kelly is brutal for prop bettors because your probability estimate always carries some error, and Kelly punishes overconfidence hard.
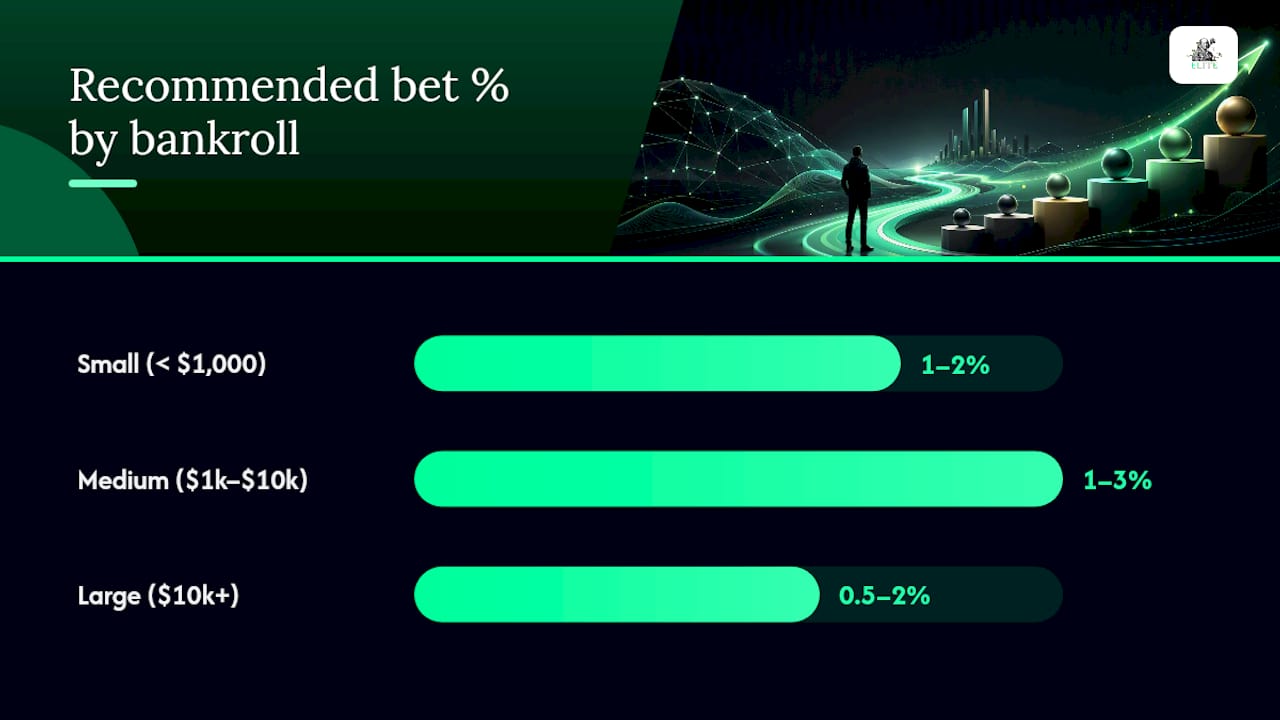
Most sharp prop bettors use fractional Kelly instead, typically a quarter or a third of full Kelly, which cuts variance sharply while still capturing most of the long-run growth.
Simple unit guidance by bankroll size:
- Small bankrolls (under $1,000): cap individual props at 1-2% per bet, even with a strong edge.
- Medium bankrolls ($1,000-$10,000): 1-3% per bet, scaling down for higher-variance stats like three-pointers or blocks.
- Large bankrolls ($10,000+): 0.5-2% per bet, prioritizing consistency over swinging for bigger single-game wins.
Pro Tip: Same-game parlays feel efficient but stack correlated risk. If you combine a player’s points prop with his team’s total, you’re not diversifying, you’re doubling down on the same outcome. Treat correlated legs as one bet, not two.
Which Tools Actually Speed Up Prop Research?
You don’t need ten browser tabs open to build a solid process. You need one reliable input from each of four categories: a projection feed for baseline probability estimates, a line aggregator for cross-book comparison, a game-log filter for recent trends and DvP splits, and a way to track your own closing line value over time.
- Prioritize odds aggregators that show no-vig probability side by side across books, not just raw lines.
- Use a game-log filter that lets you sort by minutes, usage, and opponent defensive rank, not just points per game.
- Track your own bets in a simple spreadsheet with the closing odds logged, since no third-party tool tracks your personal CLV for you.
- Avoid chasing every new modeling tool that promises an edge. Combining one projection feed, one line aggregator, and a manual sanity check beats juggling five inconsistent sources.
The biggest trap is overfitting to a single automated model without cross-checking it against your own read on minutes and matchup. A projection engine doesn’t know that a coach quietly benched his starting center for defensive reasons three games ago. You do, if you’re watching.
🏆 Elite Bettings: Documented Picks Built on This Exact Process
Elite Bettings runs the same EV-first workflow outlined in this guide on every pick we release, across the NFL, NBA, NCAAF, NCAAB, and MLB. Every play starts with a probability estimate, gets checked against no-vig market pricing, and only goes out to subscribers when it clears a real edge threshold, not a hunch.
We document every result publicly rather than cherry-picking a highlight reel.
Most services show you their best month. We show you the whole spreadsheet, win or lose, because a documented track record is the only kind worth trusting.
Here’s what you get when you check out Elite Bettings expert picks:
- ✅ EV-focused picks with transparent, documented results
- ✅ Personalized betting assistance for beginners and experienced bettors alike
- ✅ A money-back guarantee backing every subscription
- ✅ Your first pick is completely FREE 🎯
👉 Claim your free first pick and see our documented process in action 👈
If you’re placing your bets and need a reliable sportsbook to work with, Stake is our top recommendation for its odds variety and fast payouts. Sign up through this link to get started.
How In-Play Prop Betting Changes the Math
Live prop betting compresses your entire EV workflow into seconds instead of the 10-20 minutes you’d normally spend pregame, and that speed cuts both ways. Books adjust in-play prop lines based on real-time performance, but they often lag behind what you can see with your own eyes: a player who picks up early fouls and loses minutes, a starter who looks banged up and gets pulled early, or a blowout that’s about to trigger garbage-time bench minutes.
The edge in live props usually comes from reacting faster than the market repricing algorithm, not from deeper research you don’t have time to run. If a star player’s minutes pace suggests he’ll finish well under his usual total because his team is up 25 points in the third quarter, the live under on his points prop often hasn’t adjusted enough yet.
The catch: your sample size for in-game decisions is tiny, sometimes a single half of basketball, so your confidence interval is enormous compared to a pregame bet built on 50 games of data. Treat live props as a smaller-stakes, faster-reaction category, not a place to bet your standard unit size. A quarter or half of your normal stake makes sense given how much less data supports the decision.
Pace shifts matter more live than pregame too. A game that’s turned into a track meet in the second half changes the ceiling on every remaining counting stat, and that shift often shows up in the box score before the sportsbook’s model fully catches up.
Keeping Your Head Straight Through the Variance
Prop betting variance will test you in ways side betting rarely does, because a single missed rebound or a garbage-time bucket for the other team can flip a winning bet into a loss on a stat that was otherwise dead on. That randomness is baked into the math, not a sign your process is broken.
Tilt is the real threat. Losing three prop bets in a row on correct process, purely due to variance, tempts a lot of bettors into doubling their next stake to “get back to even.” That’s not strategy, that’s frustration wearing a strategy costume, and it’s how a disciplined bankroll turns into a bad night.
A few mental guardrails worth building into your routine:
- Judge your bets by process, not outcome. A well-reasoned 58% probability bet that loses was still the right bet.
- Set a stop-loss for the day or week, and walk away when you hit it, regardless of how “due” you feel.
- Review your CLV over a rolling sample of 50+ bets before judging whether your process works, not after one bad week.
- Separate research time from betting time. Making live, emotional decisions during a game you’re already invested in personally clouds your read on the data.
Confidence built on a documented process holds up under a losing streak. Confidence built on a hot streak evaporates the moment the streak ends, and that’s exactly when bettors abandon a sound strategy for no good reason.
NBA vs. NFL vs. MLB: Why One Prop Strategy Doesn’t Fit All
The core EV framework stays constant across sports, but the inputs that drive your probability estimate shift significantly depending on the sport’s structure and schedule.
NBA props reward speed and minutes-tracking because teams play nearly every other night, and injury news moves fast in a short pregame window. A player ruled out two hours before tip creates an immediate, calculable usage bump for his replacement, and bettors who react within that window capture real value before the market fully adjusts.
NFL props operate on a much slower clock. With one game a week per team, injury reports trickle out across days, giving the market far more time to price in news. The edge here tends to live more in matchup analysis, like a cornerback with a soft target share allowed, and in game-script projections, since a team trailing by two touchdowns throws far more than one that’s controlling the clock.
MLB props hinge heavily on the pitching matchup and ballpark factors. A hitter’s prop against a pitcher with a reverse platoon split, or in a stadium known for inflating home runs, needs a completely different research approach than an NBA points prop. Weather also enters the equation for outdoor MLB games in a way it never does for NBA or NFL props inside a dome or arena.
What stays the same across all three: convert the odds, remove the vig, estimate your true probability from the sport-specific signals that actually matter, and only bet when the math clears your edge threshold. The framework travels. The inputs don’t.
Why Most Bettors Get Prop Strategy Backward
Conventional prop betting advice tells you to “trust your gut” on player performance, and that’s precisely the habit that keeps casual bettors breaking even at best. The research behind this guide points somewhere more useful: the bettors who win consistently aren’t the ones who watch the most film, they’re the ones who convert odds to probability correctly and refuse to bet without a measurable edge.
The most overlooked piece isn’t the EV formula itself, it’s sample-size discipline. Bettors love a 10-game hot streak and ignore that the standard error on that sample is nearly as wide as the signal they think they found. Regression to the mean isn’t a footnote, it’s the difference between a real edge and a coin flip dressed up with confidence.
If you take one thing from this guide, take this: track your closing line value before you judge your record. A winning week means nothing if your prices are consistently worse than the closing number. A losing week on strong CLV means your process works and variance simply hasn’t caught up yet.
Turn This Framework Into Picks You Can Actually Use
Running the full EV workflow yourself, minutes tracking, no-vig conversion, sensitivity bands, and CLV logging, takes real time every single day the NBA slate runs. Elite-bettings does that work for you and hands you the output directly: a specific pick, a stated edge, and a documented track record you can verify instead of trusting blindly.
That’s the practical difference for a reader coming from this guide. You’ve now got the framework to evaluate any prop yourself, but if you want the research done and delivered before tip-off, our documented picks apply this exact process across the NFL, NBA, NCAAF, NCAAB, and MLB, backed by a money-back guarantee if a pick doesn’t hit.
Your first pick is free, no strings attached, so you can compare our EV math against your own before spending a dollar. Grab your free pick and see the process in action today.
Sources
- Expected Value in Player Prop Betting | Wizard of Odds
- NBA Player Props: Strategy, Research, and Where the Edge Actually Lives — ParlayTools
- How to Find Edge in Player Props: 2026 Prop Market Playbook | SportsBetEdge
- Prop betting strategy, explained: How to find value and use stats, avoid common mistakes and more — Sporting News
FAQ
What are some strategies for winning prop bets?
Focus on minutes and usage over box-score narratives, convert odds to no-vig probability before betting, shop lines across multiple books, and size stakes with fractional Kelly to survive the natural variance in player props.
Who bet $100 to win 1.7 million?
Stories of massive parlay payouts circulate widely in sports betting media, but they typically involve long-odds multi-leg parlays rather than single prop bets, and they represent extreme outliers rather than a repeatable strategy.
What is the 1% rule in gambling?
If I bet $100 at odds of +200, how much do I win?
At +200, a $100 bet returns $200 in profit plus your original stake, for a total payout equal to their sum.
Does Elite Bettings offer a free pick to try the process?
Yes, Elite Bettings offers a completely free first pick so you can evaluate the documented EV-based process before subscribing to full access.