 Skip to content


Reading Betting Lines: A Complete Guide for US Bettors
What betting lines tell you and how to read them fast
Betting lines are the complete package of numbers a sportsbook publishes for a game. They encode three things at once: the expected margin of victory, the projected combined score, and the straight-up win probability. Read them correctly, and you know exactly what the market thinks before you risk a dollar.
Every line has three core components:
-
Moneyline: Who wins outright. Favorites carry a minus sign (e.g., -150), underdogs carry a plus sign (e.g., +200).
-
Point spread: The handicap applied to the favorite to create a near-even market. Chiefs -7.5 means Kansas City must win by 8 or more for that bet to pay.
-
Total (over/under): The sportsbook’s projected combined score. You bet whether the actual total lands above or below that number.
American odds are the default format at every major US sportsbook. A minus sign tells you how much to wager to win $100. A plus sign tells you how much you win on a $100 bet. So -150 means bet $150 to profit $100, while +200 means bet $100 to profit $200.
Decimal and fractional formats exist too, but you will rarely need them at US books. Decimal odds show your total return per $1 staked (2.50 means $2.50 back per dollar). Fractional odds, common in UK horse racing, show profit relative to stake (5/1 means $5 profit per $1 wagered).
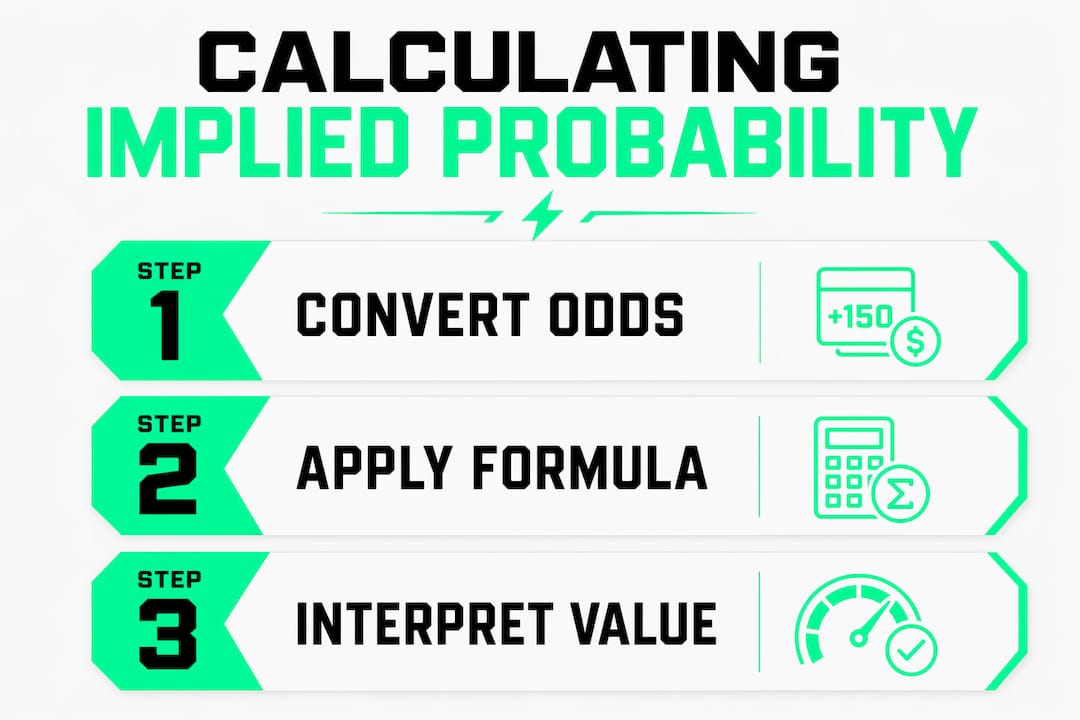
How to calculate implied probability from American odds

Every price on a betting board converts directly into a probability. That conversion is the foundation of reading betting lines with any real skill.
The formulas are short and worth memorizing:
-
Favorites (negative odds): Probability = Odds ÷ (Odds + 100) × 100
-
Underdogs (positive odds): Probability = 100 ÷ (Odds + 100) × 100
Walk through a real example. A team priced at -300 implies a 75% win probability: 300 ÷ (300 + 100) × 100 = 75%. An underdog at +400 implies just 20%: 100 ÷ (400 + 100) × 100 = 20%.
Once you have the implied probability, you have a benchmark. If you believe the true probability is higher than what the odds imply, you have found value. If it is lower, you are paying too much for that bet.
Key formulas and usage tips:
-
Always strip the minus sign before plugging into the favorite formula.
-
The two implied probabilities on a game will sum to more than 100%. That excess is the sportsbook’s margin, called the vig.
-
Converting to implied probability lets you compare odds across sportsbooks and spot which book offers the better price on the same outcome.
-
Decimal odds make this even simpler: implied probability = 1 ÷ decimal price.
Pro Tip: Before placing any bet, calculate the implied probability and write down your own honest estimate of the true probability. If the two numbers are close, skip the bet. You only want action when your estimate clearly beats the book’s.
Prediction vs. price: why the line is not just a forecast
The biggest conceptual leap in reading betting lines is understanding that the number on the board is not purely a prediction. It is a price, shaped by the sportsbook’s model and then pushed around by betting volume and built-in margin.
Sportsbooks adjust lines in response to incoming money, not just new information. If 80% of bets land on one side, the book moves the line to attract action on the other side and balance its exposure. The result is a price that reflects public behavior as much as objective probability.
What this means for you:
-
A line can move away from the true probability when the public overloads one side.
-
Sharp money (large wagers from professional bettors) triggers fast, early moves. Public money causes slower, later drift.
-
Monitoring line shifts tells you which force is driving the market.
When a line opens at Chiefs -6 and closes at -7.5 with no injury news, that move signals heavy money on Kansas City. Whether that is sharp or public matters for your decision. A total that drops from 48 to 45.5 before kickoff often reflects sharp consensus or a weather forecast, not casual fan action.
How to identify critical line value (CLV) for long-term profitability
Closing line value, or CLV, is the single most reliable indicator of long-term betting success. If you consistently beat the closing line, meaning you got better odds than what the market settled on at game time, you are betting with an edge.
Capturing positive CLV improves profitability because the closing line represents the most efficient price the market produces. Beating it means you identified value before the market corrected.
Steps to find and track CLV:
-
Record the odds at the time you place each bet.
-
Note the closing odds for the same bet at game time.
-
If your odds were better (higher for underdogs, lower for favorites), you beat the closing line.
-
Over a large sample, consistent CLV is a stronger signal of skill than win rate alone.
Market inefficiencies that create CLV opportunities include early lines posted before sharp money arrives, totals markets (which are less efficient than sides), and games where public bias inflates one team’s price.
Pro Tip: Discipline is the whole game here. Bet only when your implied probability estimate clearly beats the book’s. One value bet skipped is better than three bets placed out of boredom.
Common mistakes beginners make when reading betting lines
Most losing bettors are not unlucky. They are making the same handful of errors repeatedly.
Here are the mistakes that cost beginners the most money:
-
Misreading implied probability: Assuming a -200 favorite is a “safe” bet without calculating that it implies a 66.7% win probability. You need that team to win more than two out of three times just to break even.
-
Confusing prediction with price: Betting based on who you think will win without checking whether the odds already reflect that opinion.
-
Ignoring the half-point: A spread of -3.5 versus -3 is a massive difference in football, where 3 is the most common margin of victory. Whole-number lines can result in a push (your stake returned, no win); half-points eliminate that outcome entirely.
-
Missing line movement: Not checking where the line opened versus where it sits now. A line that moved against public sentiment often signals sharp money.
-
Chasing losses: Increasing bet size after a losing streak to recover quickly. This destroys bankrolls faster than any bad pick.
How Elite-bettings applies line value analysis to deliver winning picks
Elite-bettings is built around one principle: bet only when the line offers genuine value. Every pick the service releases goes through critical line value analysis before it reaches you.
Key elements of the Elite-bettings approach:
-
73% documented hit rate across major North American leagues, including the NFL and NBA, backed by transparent, complete records of every pick.
-
CLV analysis on every selection, comparing the release price to the closing line to verify edge.
-
Coverage of NFL, NBA, NCAAF, NCAAB, and MLB, with picks calibrated to each sport’s specific line dynamics.
-
A money-back guarantee and personalized assistance for bettors at every experience level.
73% hit rate documented across all tracked picks, with full transparency on results.
Whether you are placing your first spread bet or looking to sharpen a strategy that has plateaued, Elite-bettings gives you picks grounded in the same line value framework this guide covers.
How decimal and fractional odds formats work
Decimal odds are the easiest format to calculate with. The number represents your total return per $1 staked, stake included. A $100 bet at 3.00 returns $300 total ($200 profit plus your original $100). Anything above 2.00 is an underdog equivalent; anything below 2.00 is a favorite. To convert American odds to decimal: for positive odds, divide by 100 and add 1 (+200 becomes 3.00). For negative odds, divide 100 by the absolute value and add 1 (-200 becomes 1.50).
Fractional odds, standard in UK horse racing, show profit relative to stake. Odds of 5/1 mean $5 profit per $1 wagered, returning $6 total. If the numerator is larger than the denominator (5/1), you are looking at an underdog. If the denominator is larger (1/3), that is a strong favorite. To convert a fraction to decimal, divide the top by the bottom and add 1: 5/1 becomes 6.00.
What the point spread actually does in a betting line
The point spread exists because moneylines on lopsided games produce unattractive prices. A 14-point NFL favorite might sit at -800 on the moneyline, meaning you risk $800 to win $100. The spread converts that into a roughly even-money bet by applying a handicap.
When you see Chiefs -7.5 (-110), two numbers are working. The -7.5 is the handicap: Kansas City must win by 8 or more for the bet to pay. The -110 is the price: you risk $110 to win $100. In football, key numbers like 3 and 7 carry outsized weight because those are the most common margins of victory. A line moving from -2.5 to -3.5 is a much bigger shift than one moving from -8.5 to -9.5.
How moneyline odds differ from spread and totals bets
The moneyline is the simplest bet: pick the winner, no handicap involved. The spread forces you to pick a winner by a margin. Totals ignore the winner entirely and ask only whether the combined score clears a number.
In practice, these three markets suit different situations. Moneylines work best when you have a strong opinion on the winner but the spread feels uncertain. Spreads are the workhorse in football and basketball, producing near-even-money action on every game. Totals are often the least efficient market because casual bettors focus on who wins, not how many points get scored. That lower public attention means totals lines can move slower on relevant news like weather or lineup changes, creating more opportunity for bettors who track that information.
Using betting line trends and historical data for analysis
Line movement history is one of the most underused tools available to US bettors. When you track where a line opened and how it moved to close, you build a picture of market consensus over time.
Cross-referencing the spread, total, and moneyline reveals the sportsbook’s implied final score. If the spread is -7.5 and the total is 47.5, the implied score is approximately 27.5 to 20. Inconsistencies between these three components can signal a mispriced line worth targeting.
Historical trends by sport also matter. NFL totals move predictably in cold-weather outdoor games. NBA spreads tighten late in the season when teams rest starters. Tracking these patterns across multiple seasons gives you context that a single game’s line cannot provide on its own.
How to adjust your betting strategy based on line movement
Line movement tells you where the money is going. Your job is to decide whether to follow it or fade it.
When a line moves early and sharply, that typically reflects professional bettors acting on information before the public catches up. Betting with that move, called “following the sharp action,” is a reasonable strategy when you have no strong opinion of your own. When a line moves late and gradually toward a popular team, that is usually public money, and fading that move (betting the other side) has historically been a profitable approach in certain markets.
Timing matters too. Odds posted days before a game are less efficient than closing lines. Getting your bet in early, when the line is softer, is how you capture CLV. Waiting until game time means betting into the most efficient price the market will produce.
Key Takeaways
Reading betting lines effectively requires converting odds to implied probability, separating the sportsbook’s price from its prediction, and betting only when your estimate of true probability beats the market’s.
| Point | Details |
|---|---|
| American odds basics | Minus odds show how much to wager to win $100; plus odds show profit on a $100 bet. |
| Implied probability formulas | Favorites: Odds ÷ (Odds + 100) × 100. Underdogs: 100 ÷ (Odds + 100) × 100. |
| Prediction vs. price | Sportsbooks adjust lines for betting volume, so the price reflects market activity, not just the true probability. |
| CLV as a success metric | Consistently beating the closing line is a stronger indicator of long-term edge than win rate alone. |
| Half-point rule | A spread of -3.5 vs. -3 is a critical difference in football; half-points eliminate pushes entirely. |
FAQ
What does a minus sign mean in betting odds?
A minus sign identifies the favorite and shows how much you must wager to win $100. For example, -150 means you bet $150 to profit $100.
How do you calculate implied probability from American odds?
For favorites, divide the odds by (odds + 100) and multiply by 100. For underdogs, divide 100 by (odds + 100) and multiply by 100. A -300 line implies a 75% win probability.
What is the difference between moneyline and spread betting?
A moneyline bet wins if your team wins outright, regardless of margin. A spread bet requires your team to win by more than the handicap, or the underdog to lose by less than the handicap.
What does line movement signal?
Early, sharp line movement usually reflects professional bettors acting on information. Late movement toward a popular team typically reflects public money, which experienced bettors often fade.
What is closing line value (CLV)?
CLV measures whether the odds you got were better than the final closing price. Consistently beating the closing line indicates you are finding real value, which is the strongest predictor of long-term profitability.